
Have you ever wondered which North American region has the most casinos or who makes the most money from gambling? Read on to find out who leads the casino industry in 2025.
To determine the leading casino markets in 2025, BonusFinder - North America's leading casino bonus and online casino review site - examined gambling data across all US states and Canadian provinces.
North American casino rankings
To reveal which US states and Canadian provinces lead the gambling industry in 2025, we considered a variety of factors, including number of casinos in total and per adult population, gross gaming revenue in 2024 in total and per adult population, and gross gaming revenue generated by land-based casinos last year in total and per adult population.
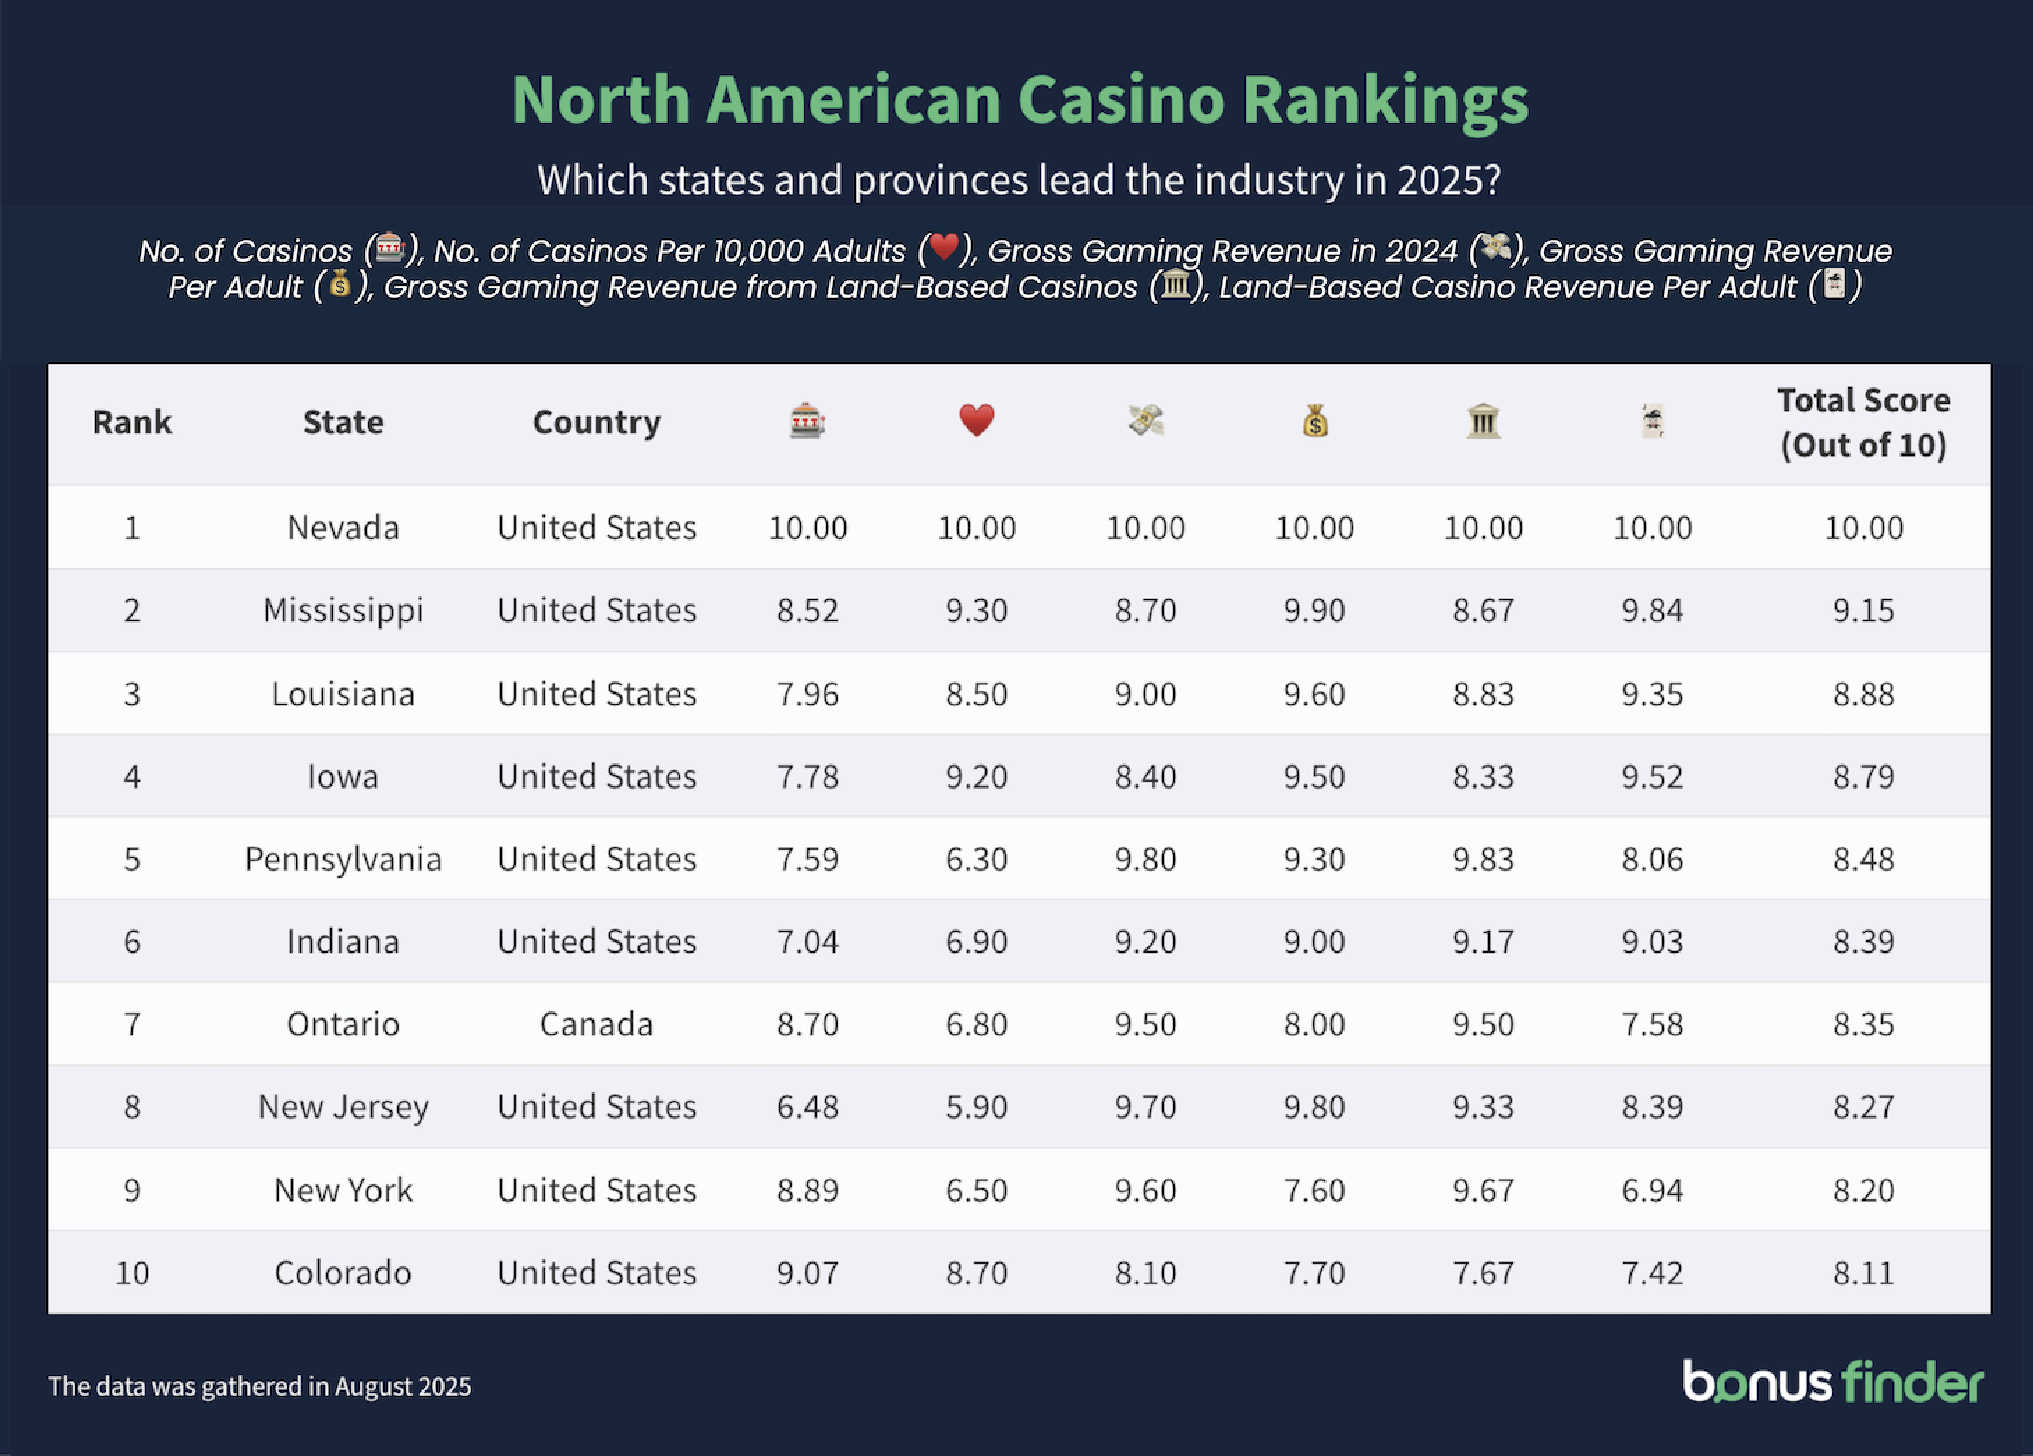
When it comes to casinos, there is one undeniable leader in North America. Crowned as the industry's brightest star, Nevada, home of the gambling capital of the world, Las Vegas, secured a perfect ten in each of the categories measured.
Taking second place is Mississippi, with a total score of 9.15 out of 10. The Magnolia State ranked second for its gross gaming revenue (GGR) per adult ($1,071.2) and for its gross land-based casino revenue per adult ($890).
Louisiana came in third with a score of 8.88 out of 10, performing well across all categories. Its highest scores include ranking fifth for its GGR per adult ($781.6) and for its land-based casino revenue per adult ($657).
Ranking fourth with a score of 8.79 out of 10 is Iowa, which ranked 11th for its total land-based casino revenue ($1.69bn) and fourth for the land-based revenue per adult ($673).
Pennsylvania took fifth place, thanks to its third highest gross gaming revenue in 2024 ($6.87bn) and second highest land-based casino revenue ($323) in the region.
Indiana, Ontario, New Jersey, New York and Colorado completed the top 10.
Which states and provinces have the most casinos?
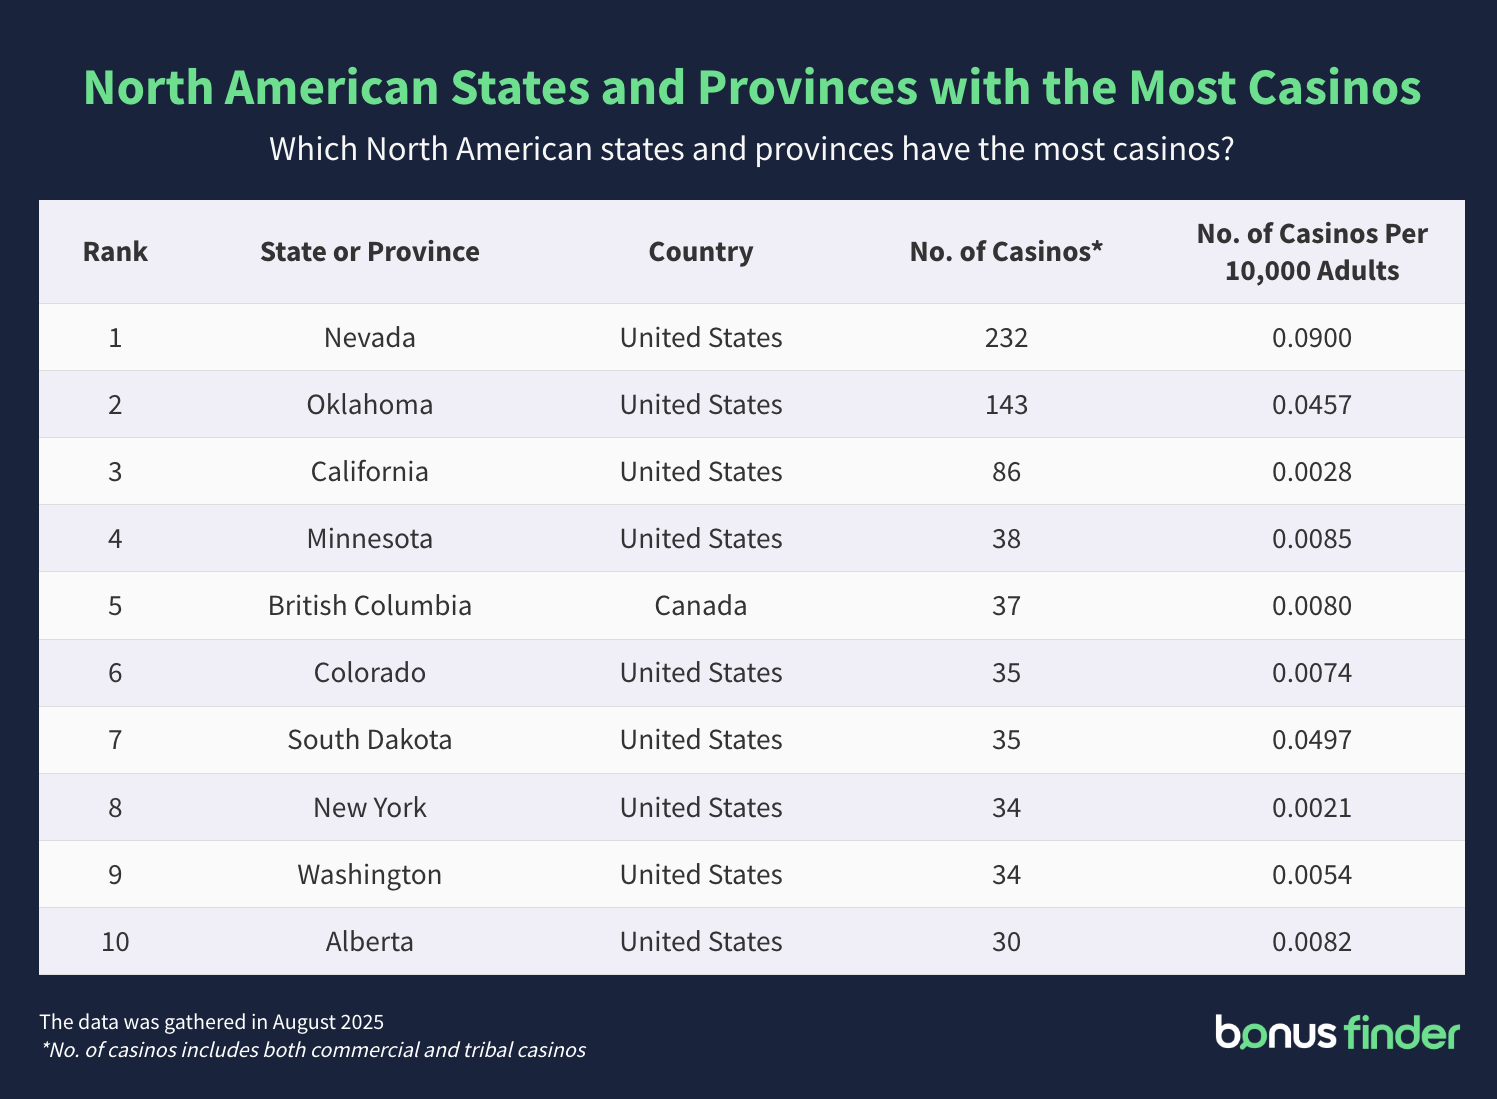
With 232 commercial and tribal land-based casinos, Nevada tops the list of the most casinos in North America.
Ranking second with 143 casinos is Oklahoma, thanks to its high concentration of tribal casinos (141).
California ranks third with 86 casinos, while Minnesota and British Columbia secure fourth and fifth place in the rankings with 38 and 37 casinos, respectively.
Sharing sixth place are Colorado and South Dakota with 35 casinos each, while New York and Washington tied for the next spot with 34 casinos.
The 10 was completed by Alberta, with 30 casinos.
Which states and provinces have the most casinos per capita?
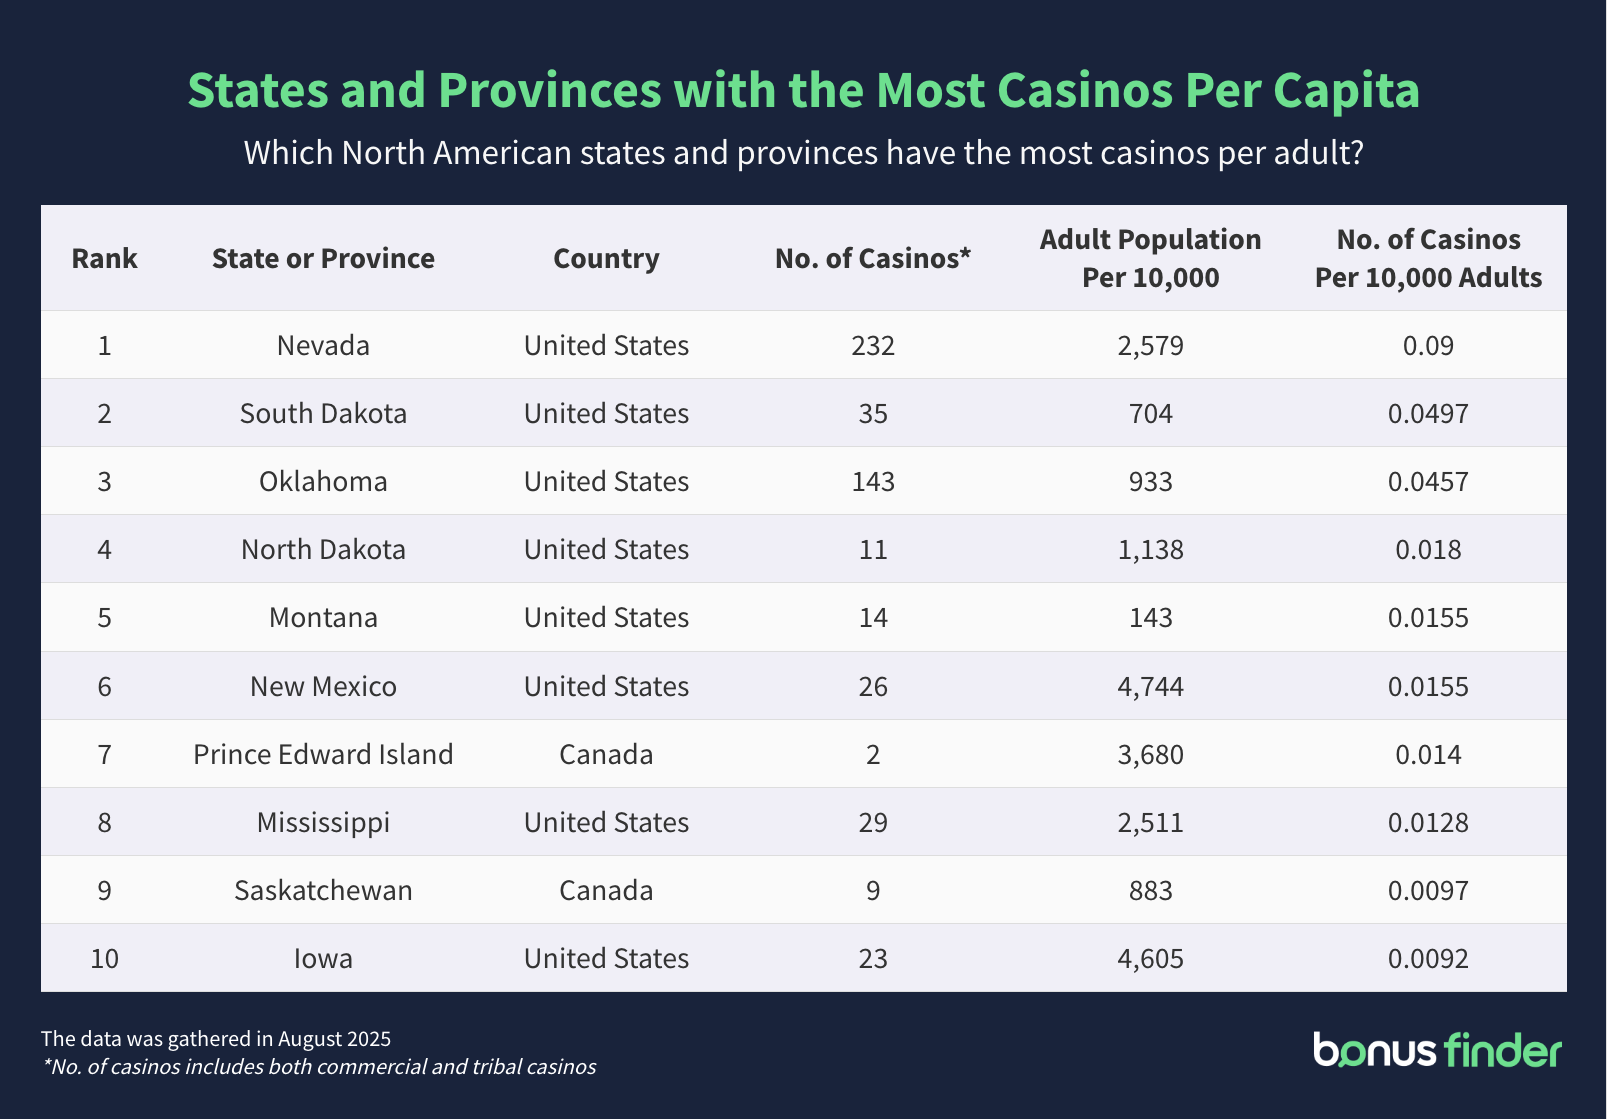
As well as being home to the most commercial casinos overall, Nevada also topped the list of most casinos per capita (0.09 per 10,000 people).
South Dakota placed second with 0.0497 casinos per 10,000 people, while Oklahoma had the third highest number of casinos per capita (0.0457).
Ranking fourth was North Dakota (0.018), while Montana and New Mexico tied for fifth place (0.0155).
The other North American regions that ranked in the top 10 for most casinos per capita included Prince Edward Island (0.014), Mississippi (0.0128), Saskatchewan (0.0097) Iowa (0.0092).
What are North America's biggest casino markets based on revenue?
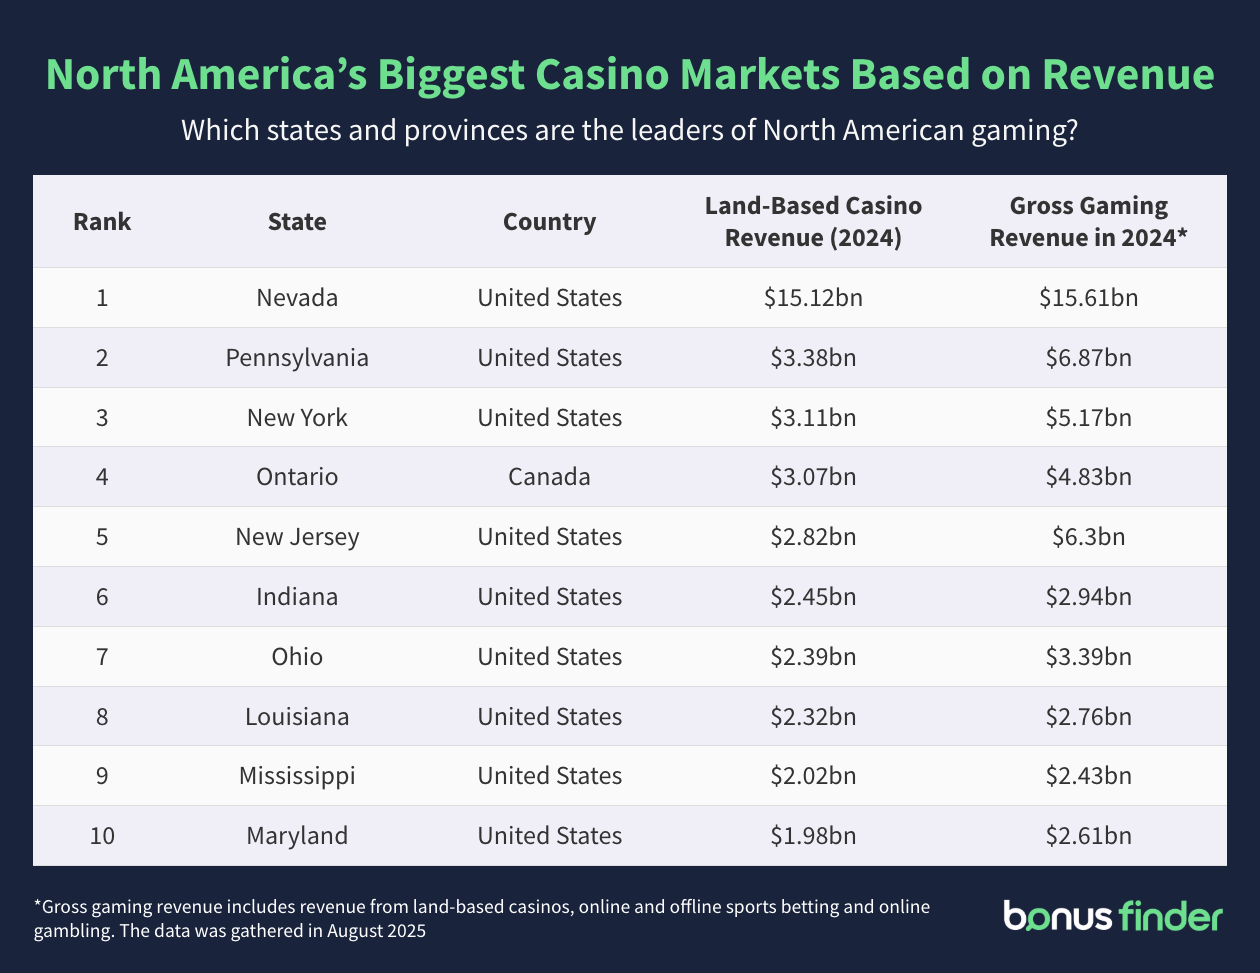
When it comes to North America's biggest casino markets, Nevada left its competitors in the dust with its brick and mortar casinos making a whopping $15.12bn in revenue in 2024. This figure is higher than the combined revenue of the next five biggest markets' - equal to $14.9bn.
More than $8.8bn of this figure was generated in the Las Vegas Strip, which also ranked as the biggest regional casino market in the country, far surpassing Atlantic City which came in second with $2.8bn.
Ranking as the second biggest casino market in North America with $3.38bn is Pennsylvania, while New York ranked third with $3.11bn.
Ontario took fourth place with annual land-based casino revenue of £3.07bn, while New Jersey and Indiana followed in fifth and sixth place with revenues of $2.82bn and $2.45bn, respectively.
The list of the top 10 biggest casino markets in North America was completed by Ohio ($2.39bn), Louisiana ($2.32bn), Mississippi ($2.02bn) and Maryland ($1.98bn).
What are North America's biggest casino markets based on revenue per capita?
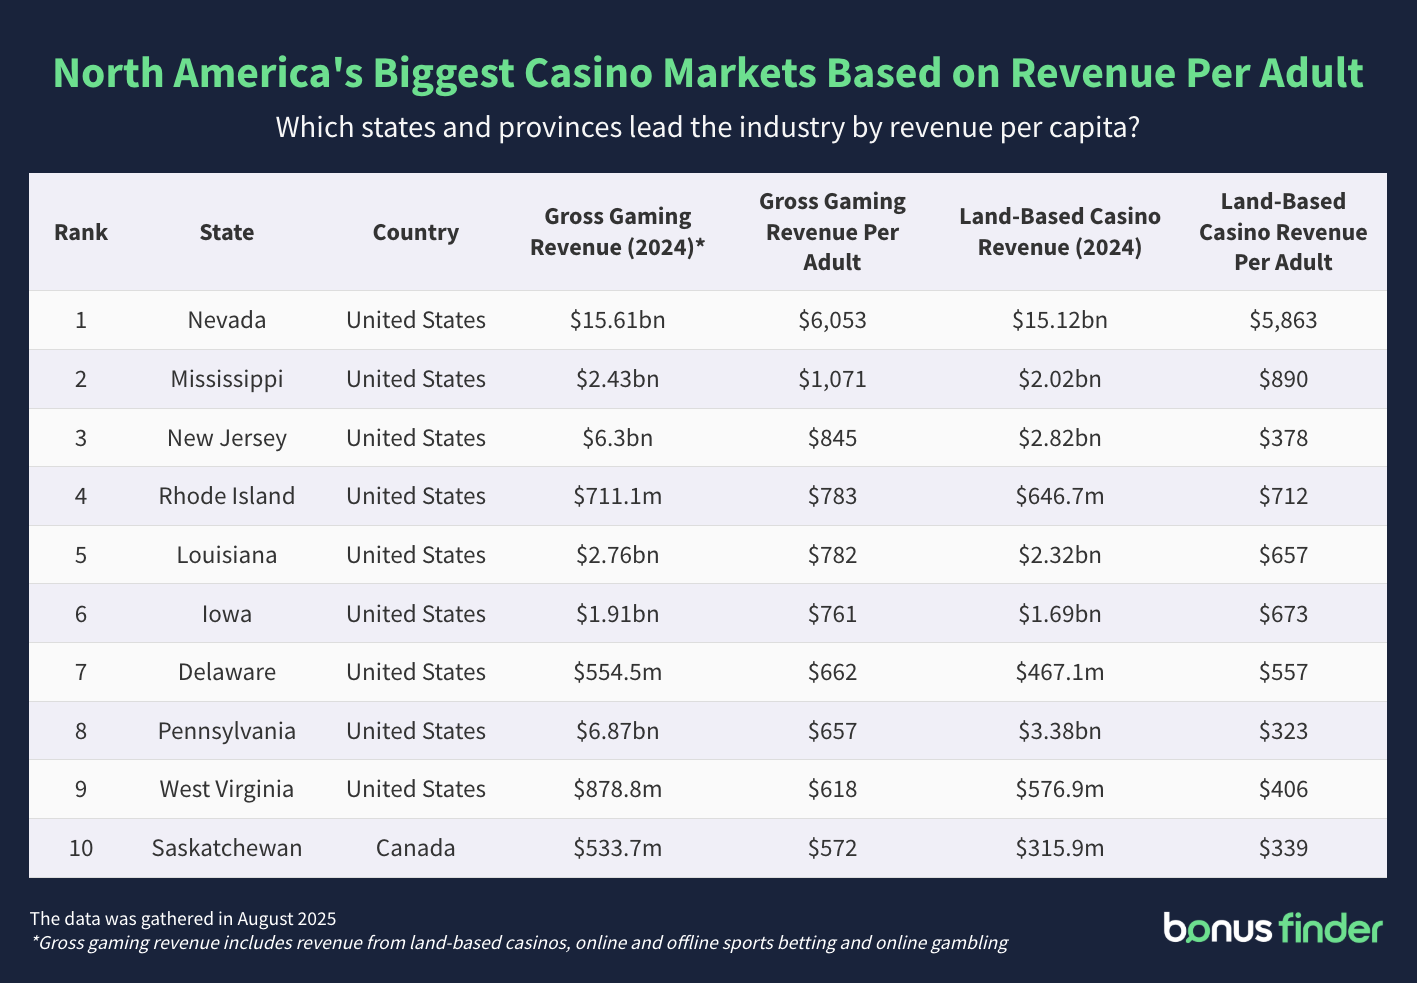
Ranking at the top for highest casino revenue per capita is - yet again - Nevada. With the state's annual gross gaming revenue ($15.61bn) divided by its adult population of 2.58 million, the revenue per adult equals to a staggering $6,053 per adult.
Coming in second is Mississippi, with a gross gaming revenue of $1,071 per adult.
The Magnolia State was followed by New Jersey ($845) in third place, Rhode Island ($783) in fourth place and Louisiana in fifth place ($782).
The top 10 was completed by Iowa ($761), Delaware ($662), Pennsylvania ($657), West Virginia ($618) and Saskatchewan ($572).
Which North American land-based casino markets generate the highest revenue per capita?
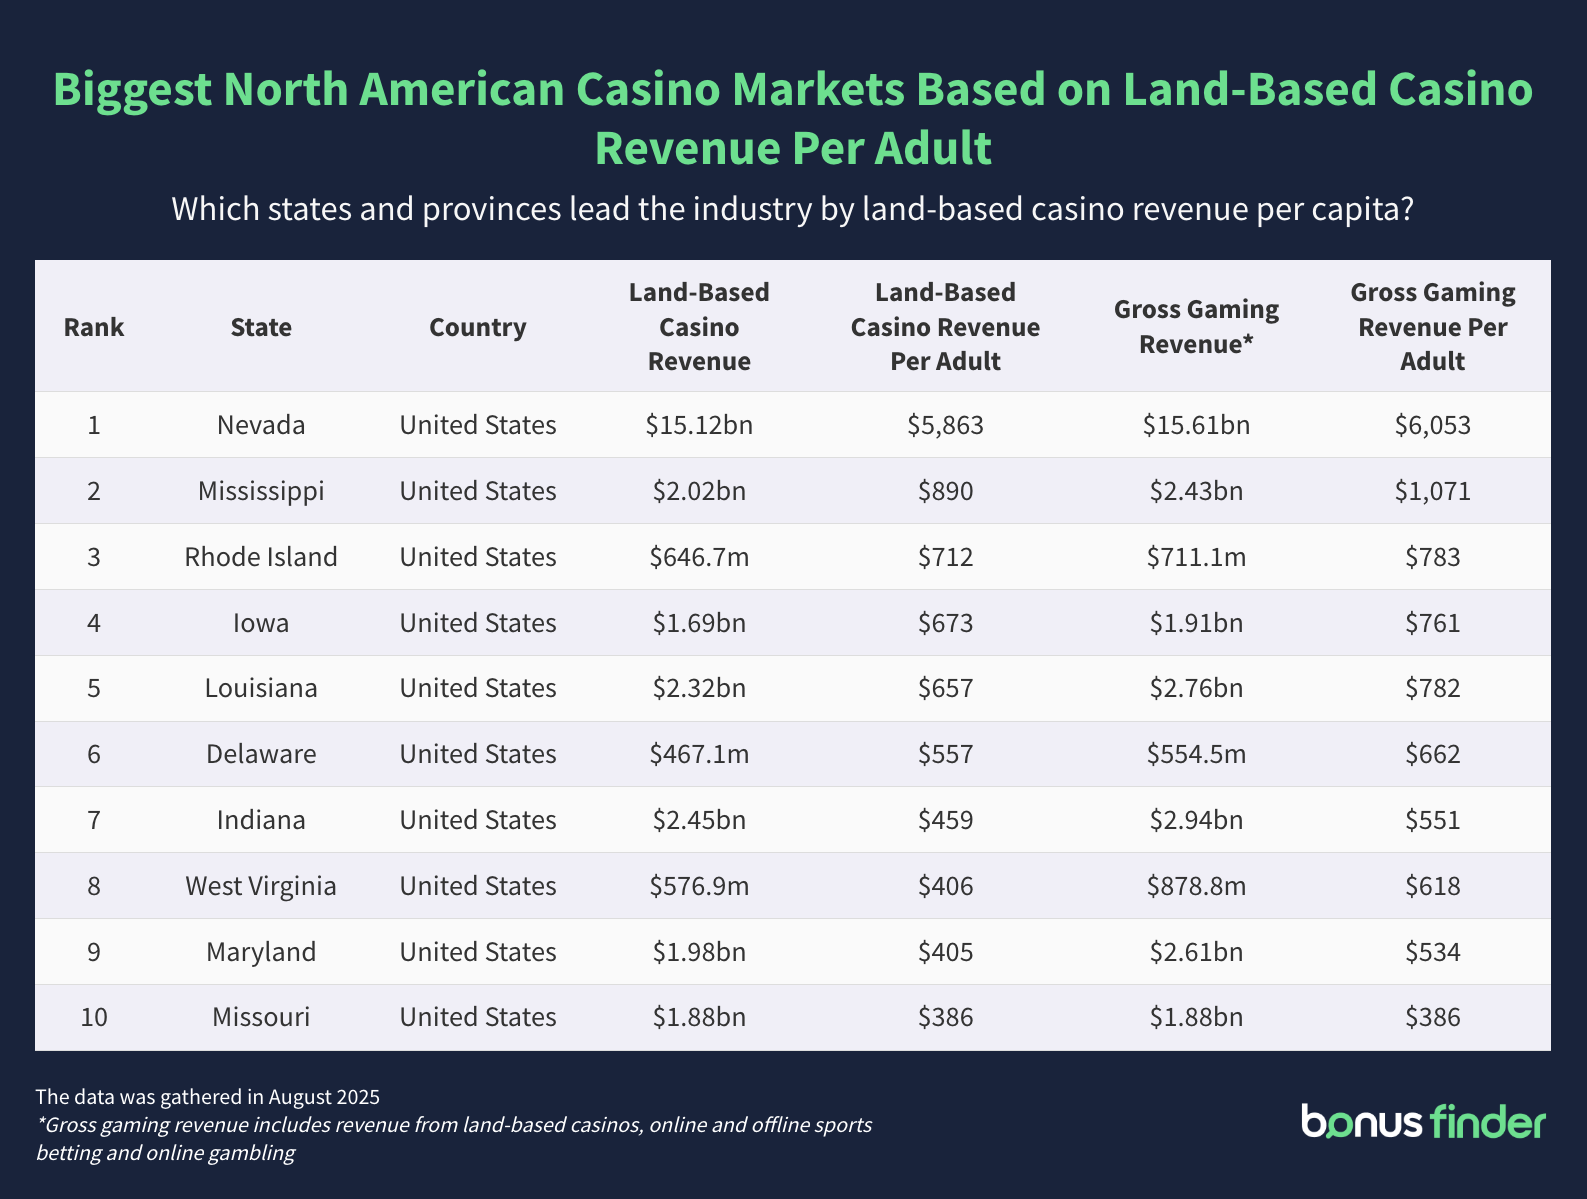
When it comes to averaging the revenue spent per adult in land-based casinos, Nevada also topped the list with $5,863 per adult - a figure higher than all of the other top 10 states combined.
Mississippi followed in second place with $890 per adult, while Rhode Island and Iowa came in third and fourth with land-based casino revenues of $712 and $673 per adult, respectively.
The top 10 was completed by Louisiana ($657 per adult), Delaware ($557), Indiana ($459), West Virginia ($406), Maryland ($405) and Missouri ($386).
What are North America's biggest online casino markets?
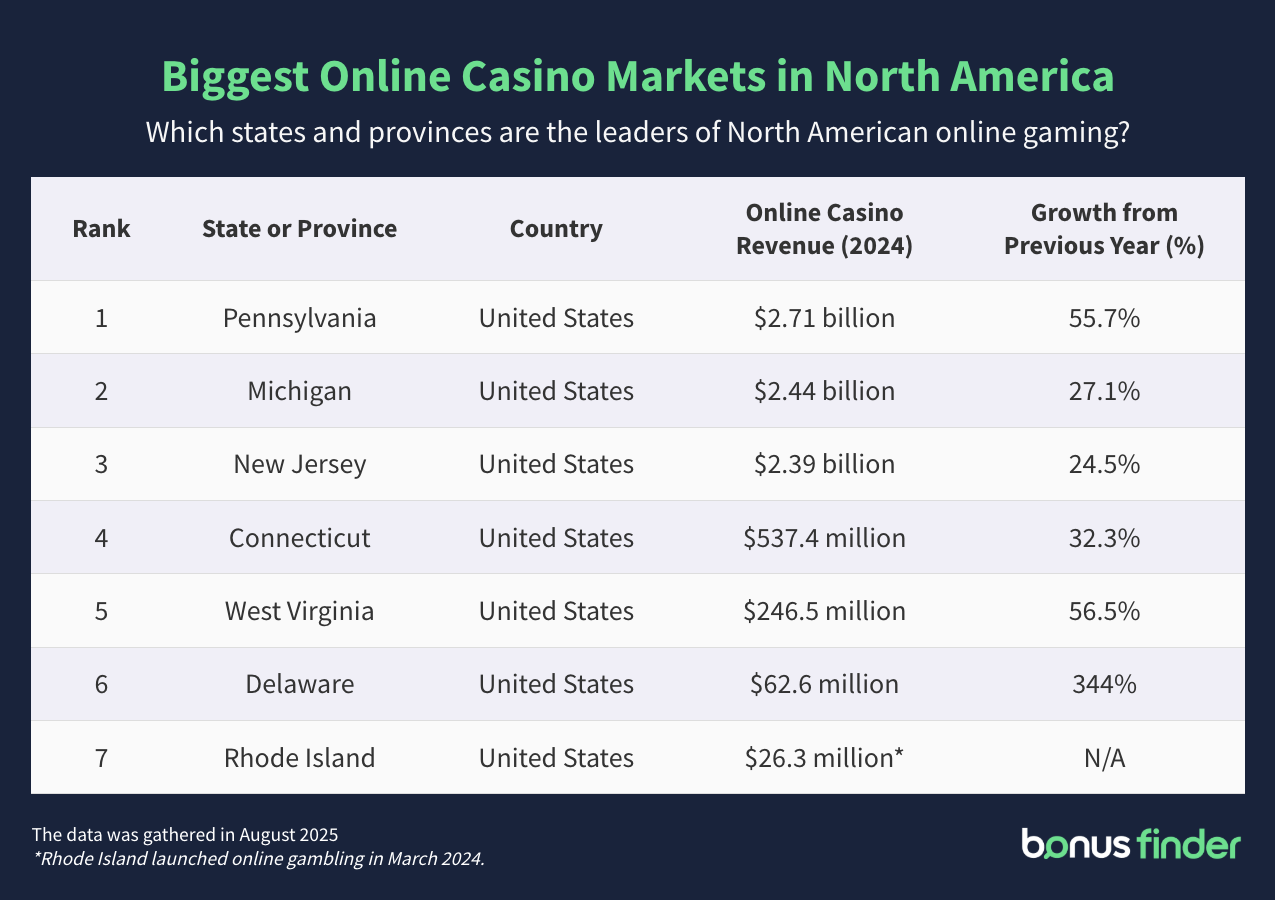
Topping the list for best performing online casino market in North America is Pennsylvania, with $2.71bn in revenue generated in 2024. Pennsylvania's online casino market saw a 55.7% increase from the previous year ($1.74bn).
Overall, the state's online casino revenue has seen an increase of 379% since its first full year of launching in 2020, when it generated $565.8m in revenue.
Ranking second with online casino revenue of $2.44bn is Michigan, with an increase of 27.1% from the previous year, while New Jersey ranked third with $2.39bn.
Connecticut took fourth place with online casino revenue of $537.4m - marking an increase of 32.3% compared to the previous year.
Other markets where online gambling is legal also performed well with West Virginia growing its revenue by 56.5% from the previous year to $246.5m, and Delaware increasing its revenue by a staggering 344% to $62.6m.
Rhode Island, which launched its online casino market in March 2024, made $26.3m.
Which states and provinces earn the most tax revenue from gambling?
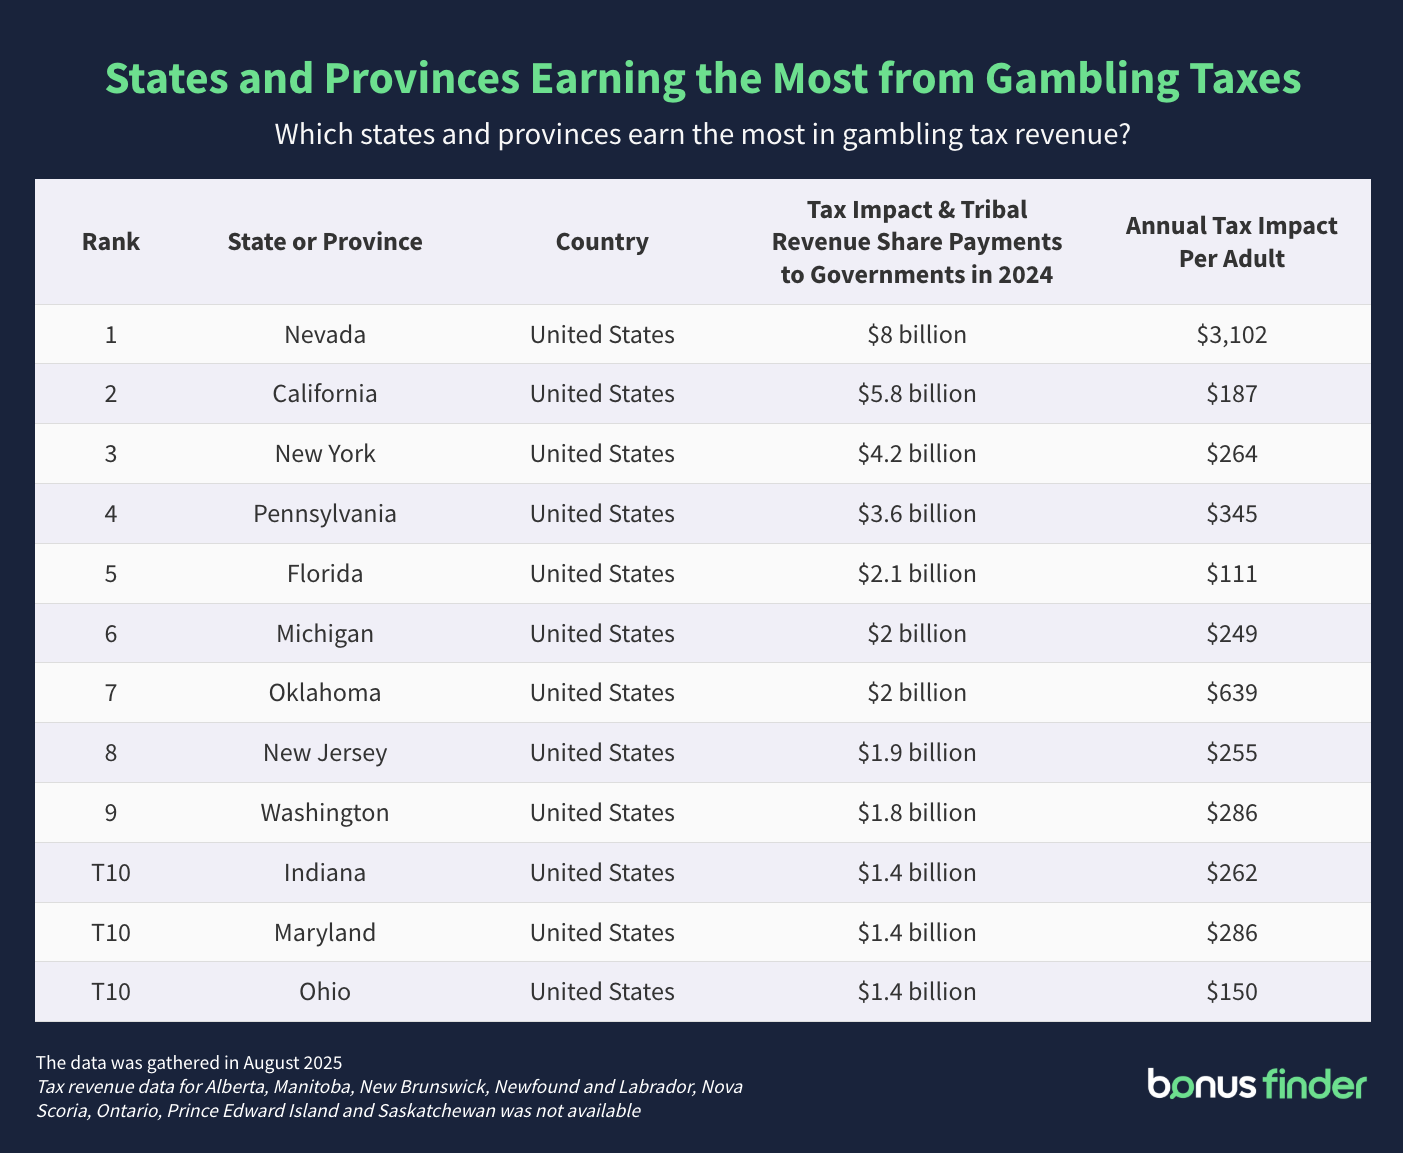
Thanks to its massive casino market, Nevada is also revealed to generate the most money from its gambling industry.
Measuring the full tax impact from revenue generated by casinos - including gaming taxes on revenue, corporate and property taxes, employee payroll taxes, sales taxes, and tribal casinos' payments from revenue - Nevada's gaming industry contributes $8bn in taxes.
This revenue goes directly to Nevada's general fund and is primarily used to fund the state's educational programs and its public transportation systems.
In 2022, the state's gaming industry generated more than a third (35%) of the state's general fund revenue.
The second state that benefits the most from gambling tax revenue and tribal payments is California, with $5.8bn generated in 2024 and used to support local governments and fund programs tackling problem gambling.
Ranking third with $4.2bn in gaming tax revenue is New York, where the money is essential to funding the state's school districts.
With a tax revenue of $3.6bn, Pennsylvania ranks fourth on the list, while Florida comes in fifth with $2.1bn.
The top 10 states that earn the most through gaming taxes was completed by Oklahoma ($2bn), Michigan ($2bn), New Jersey ($1.9bn), Washington ($1.8bn), Maryland ($1.4bn), Indiana ($1.4bn) and Ohio ($1.4bn).
Which states and provinces earn the most tax revenue from gambling per capita?
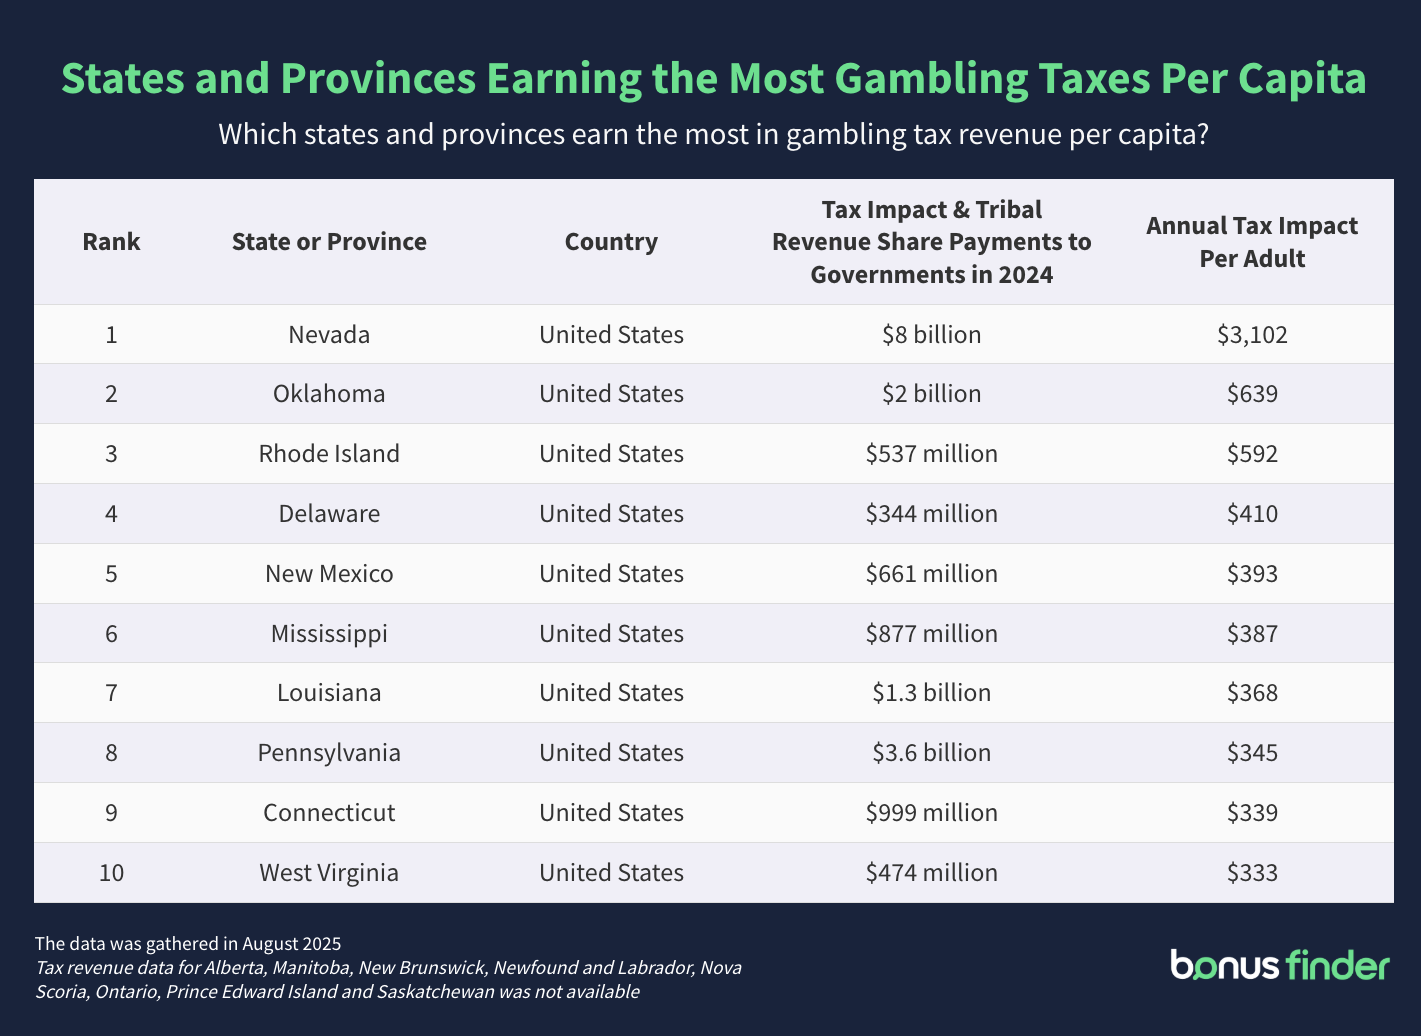
When it comes to states that make the most tax revenue from gambling per adult, the undeniable winner of nearly all casino rankings - Nevada - leads the pack again, generating a whopping $3,102 in tax revenue per adult.
Coming in second and third with $639 and $592, respectively, are Oklahoma and Rhode Island.
Meanwhile, Delaware took fourth place with $410 per adult, while New Mexico ranked fifth with $393, respectively.
The top 10 was completed by Mississippi ($387), Louisiana ($368), Pennsylvania ($345), Connecticut ($339) and West Virginia ($333).
Read more
North America's casino capitals
Top 10 female World Series of Poker players of all time
Alberta online casino legislation: Where are we at now?
Methodology
Please note that the revenues for US states are measured in calendar years, while the figures for Canadian provinces are measured in fiscal years. For Canadian provinces, fiscal year 2024–25 revenue figures were used where available (Quebec, Saskatchewan, Ontario), while the most recent data (2023–24) was used for other provinces.
Sources
The majoirty of US data was sourced from the American Gaming Association.
Other sources used include: Nevada Gaming Control Board, NJ.gov, US Census Bureau, Lotteries & Gaming Saskatchewan, Alberta Gaming, Liquor and Cannabis, iGaming Ontario, Loto-Québec, Government of British Columbia and University of Calgary's Canadian Gambling Statistics.